A man asks his wife why she’s not driving faster on the way to the golf course. She says they’re on pace to be early anyhow. “That can’t be,” says her husband, “I double checked the GPS and we’re going to be fifteen minutes late.” “Settle down,” said his wife, “we’ll be there by 10:00 AM.” The man was exasperated. “If we get there at 10:00 we won’t have time for breakfast with my mother before we tee off.” “Precisely,” said his wife.
***
Thinking About Thinking is a new series I will be writing periodically with articles mostly devoid of fancy stats, film breakdowns, and narratives. Instead, I want to focus on the underlying assumptions which lead us to make the decisions we do. In fantasy football, we often debate in parallel. Essentially, I’m arguing X because I want Y, and you’re arguing Z because you want P. We act as the husband and wife did above – locked in an argument about how fast to drive that is entirely irrelevant to their disagreement.
Fantasy Football is a strategy game with football inputs. And in this column I will focus much more on the strategy than the hashmarks. What are the broad strategic goals you should be pursuing, and how do you reach them? How do you leverage your strengths to maximize your value? What underlying biases in our brains promote inefficient decisions? How do you work toward mutual benefit with those different from yourself?
Prospecting Through Humility
If you ran a word association game on Twitter, analytics and humility may not be placed together often. The analytics circle of life in recent years has been producing data, being misunderstood, making snide comments about those who misunderstand, and continuing to foster division regarding what analytics is and what it’s aiming to do. It is a paradox, even if an earned one, that the analytical community has been labelled as arrogant or dismissive. In reality, the guiding principle of any analytical project is an understanding of uncertainty and a thirst for more information.
When it comes to prospecting for dynasty rookie drafts, the ‘analytics vs. film’ wars are an annual tradition. But like many brutish, human traditions from the Colosseum to Color Rush jerseys, I hope it ends.
In this initial entry I wish to explain what analytical modelling is attempting to do in a general sense. I believe with better marketing and an honest attempt at understanding, we could have a much more productive discourse.
Thinking Probabilistically
If there is one theme I try to integrate in all work it’s the importance of thinking probabilistically. What do I mean by this?
A Thought Experiment
A lot of fantasy data is tracked in a binary sense, but we should not forecast it in such a way. Take for example the following statement: “out of every 100 red apples on a tree, 40 are sellable at the market.”
Knowing nothing else, if you ask me to guess whether any given red apple is sellable at the market, I would say no. If you asked me the same question about all 100 apples on the tree, I would say “no” 100 times, knowing I will likely be wrong on 40 guesses, and correct on 60.
What if you decided to try to guess every apple correct? You would probably guess ‘yes’ for 40 apples and ‘no’ for 60. How many would you be correct about on average?
C = expected number of correct guesses ; p(n) = probability of correctly guessing NO ; p(y) = probability of correctly guessing YES
C = p(n)*60 + p(y)*40 ; C = 0.6*60 + 0.4*40 ; C = 52
On average, you will guess eight less apples correctly with this approach. Therefore, for any given apple you should clearly guess no, even though you’re likely to be wrong a significant proportion of the time. Now let’s add another layer.
Comparing Apples to Apples
The same orchard has a tree of green apples. “Out of every 100 green apples on a tree, 60 are sellable at the market.”
You are given one green and one red apple, and asked to decide each time if either, both or neither is sellable at the market. As discussed above, on each red apple you should guess ‘no.’ Following from that, on each green apple, you should guess ‘yes.’ Therefore, the optimal guess on each outcome is to guess that the green is sellable and the red is not. How often would you be correct?
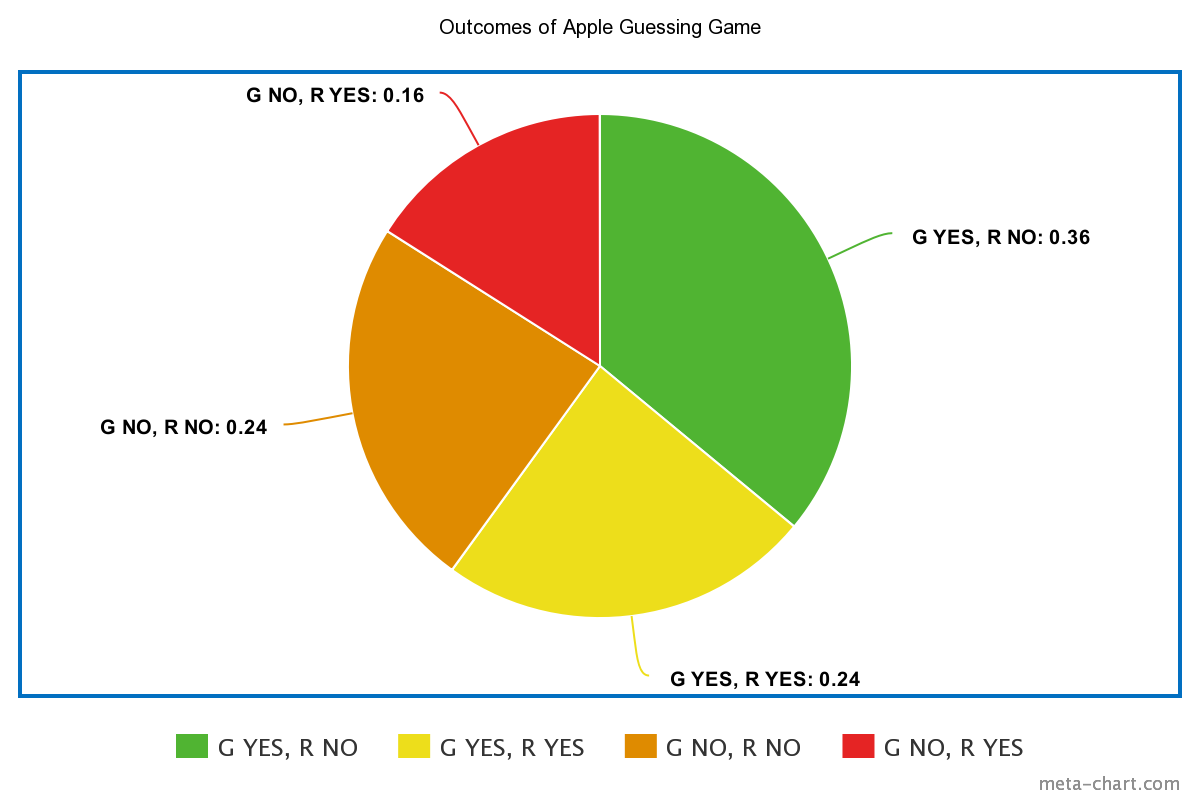
Correct on both apples = p(G) * p(R) = 0.6 * 0.6 = 0.36
Only 36-percent of the time you would guess correctly while making the optimal choice.The pie chart below demonstrates the odds of each outcome between the two apples.
Some Earth, Somewhere, N’Keal Harry is a WR1 and Hillary Clinton is President
If we assessed the apple-picking game in the form of a fantasy football prospect model, one would afford all green apples in a 60-percent ‘hit rate,’ and each red apple a 40-percent ‘hit rate.’ As we just demonstrated, if there was one green apple prospect and one red apple prospect every year, the model would only be ‘successful’ in forecasting both apples 36-percent of the time. What a crappy model, eh?
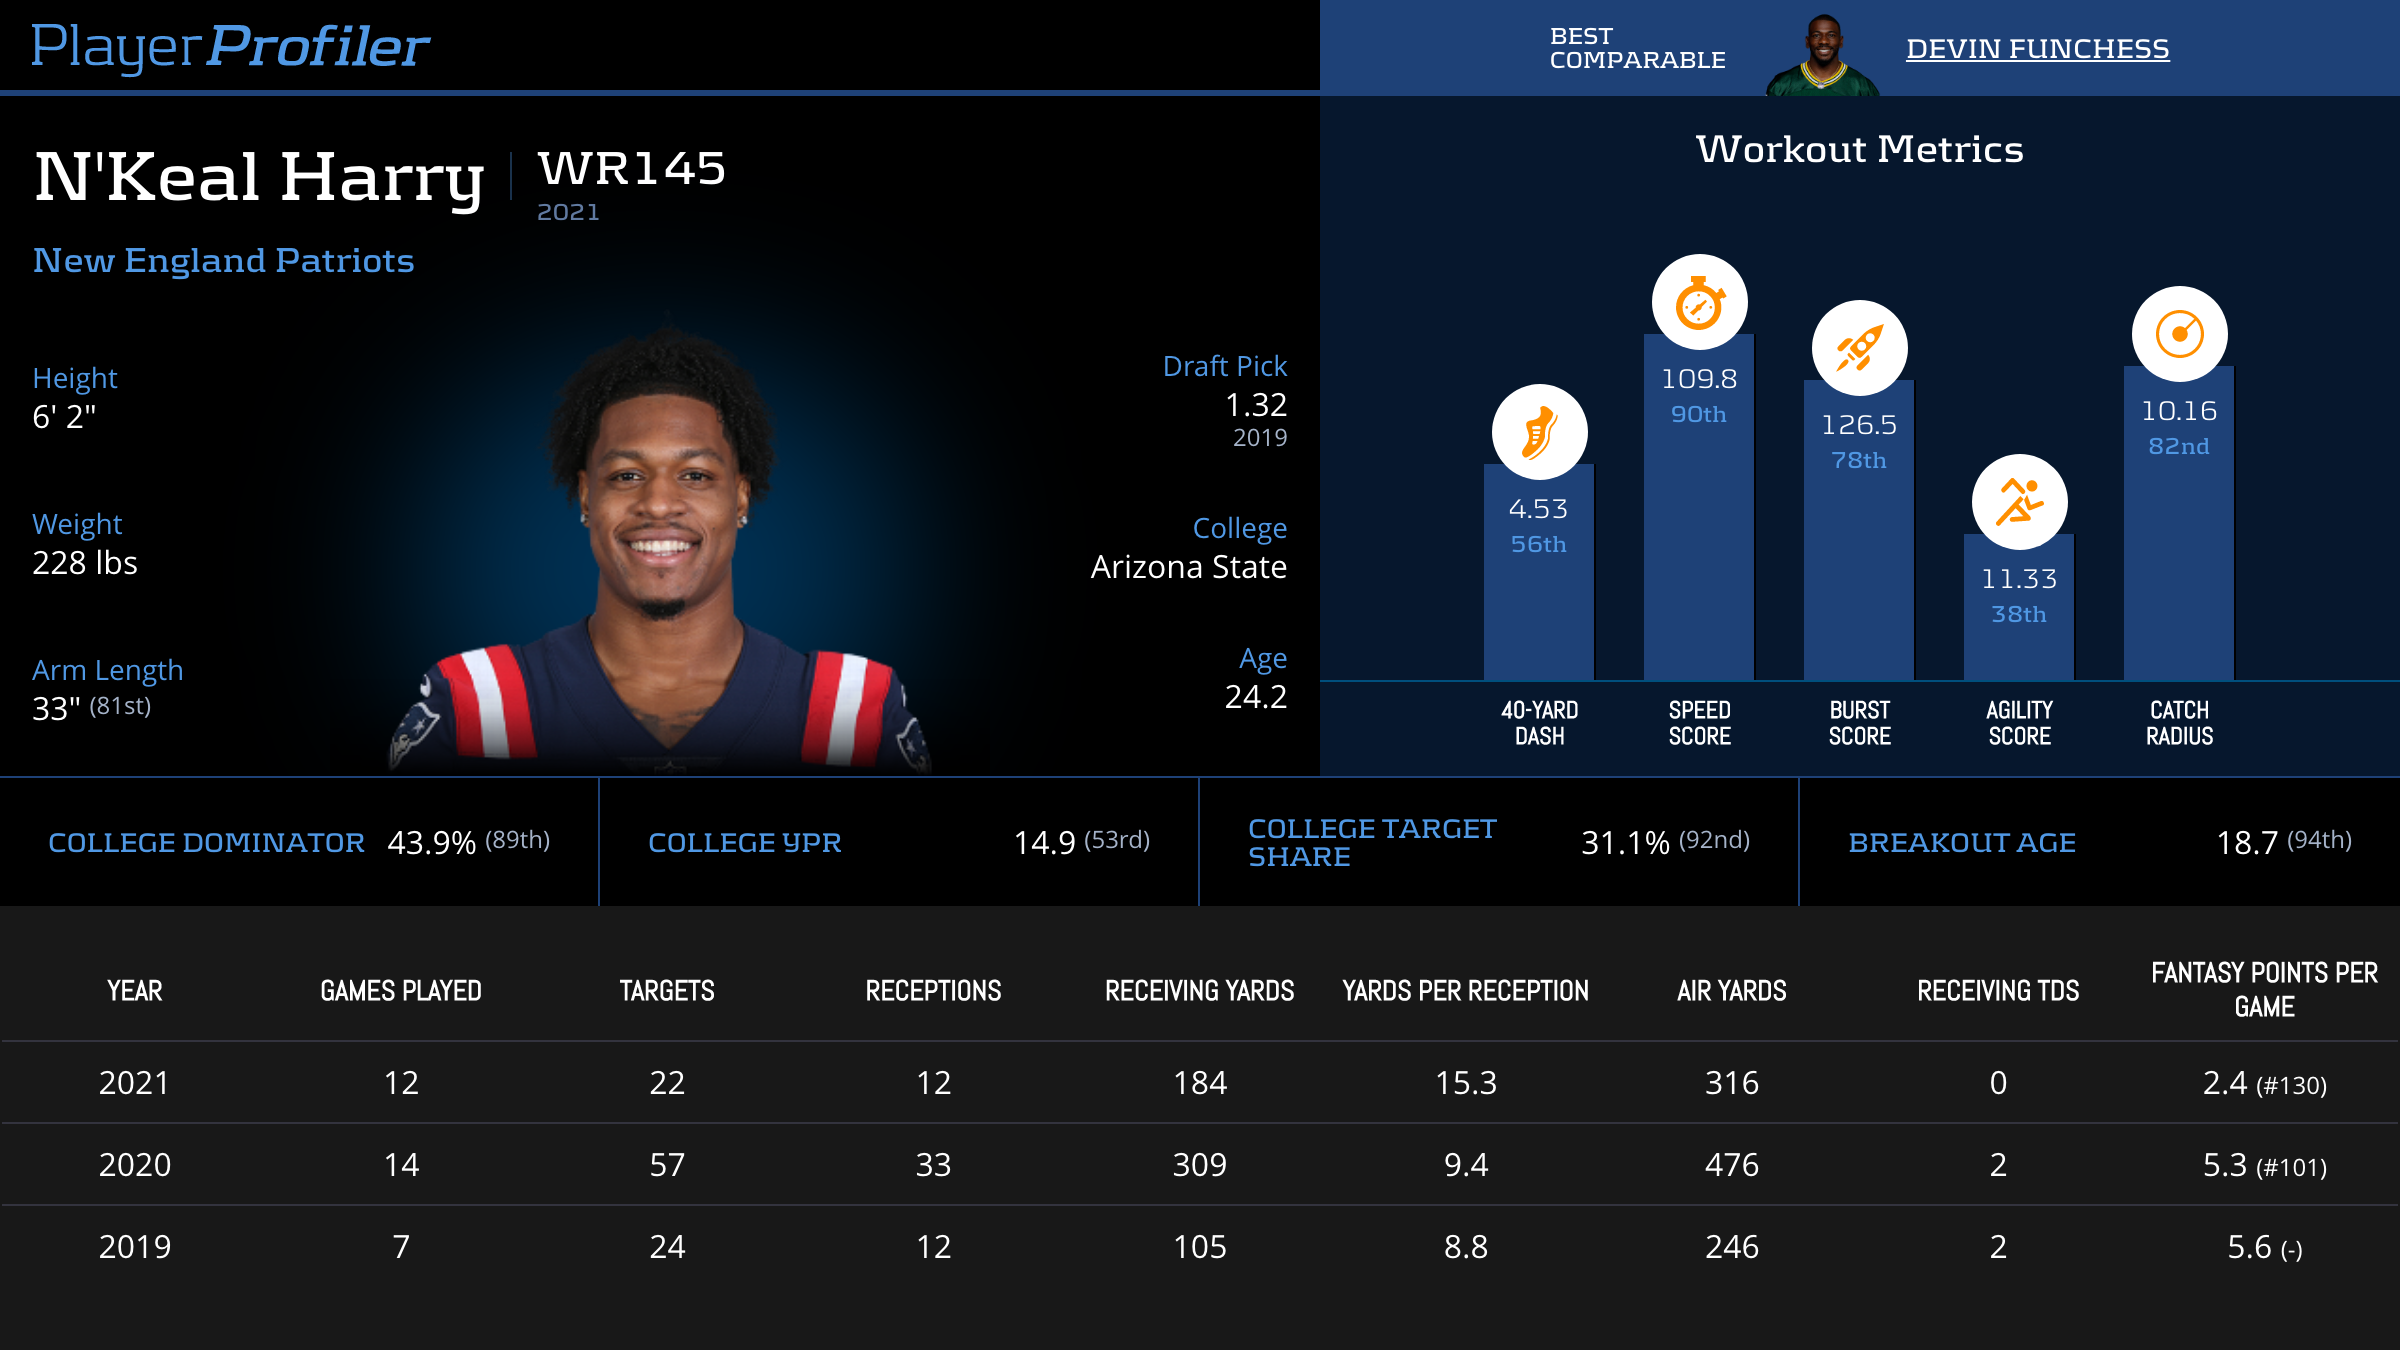
This is the root of the negative feedback Nate Silver received with regard to his model being ‘wrong’ when Donald Trump won the 2016 election. Silver’s model did not claim definitively who would win the election, but stated that given the information available Clinton would seven of 10 times. Given we only saw one outcome, it is impossible to say whether that was an accurate assessment. Should Trump’s odds to win have been set higher than 30-percent? Or did an event that had a 30-percent chance to happen manifest? Perhaps it is a mix of both. But anyone telling you N’Keal Harry was certain chance to bust or Trump was certain to win is as silly as a person telling you any of the aforementioned apples is certain to be sold at the market.
How to Capture the Success of an Analytical Model
Luckily, in fantasy football we have far more outcomes to point to when building and assessing the strength of a model than Silver does with presidential elections. Drew Osinchuk joined The PodFather to discuss the process and result of ‘bucketing’ players on a recent podcast.
Drake London, WR1 of the 2022 rookie class?👀
Drew Osinchuk (@DFBeanCounter) joins The Podfather Matt Kelley (@Fantasy_Mansion) to lay out THE optimal 2022 rookie draft strategy.
🎧https://t.co/CJbSvY68Yc#nfl #football #FantasyFootball pic.twitter.com/KDTGvN8Y9m
— PlayerProfiler (@rotounderworld) February 25, 2022
Drew’s ‘Bulletproof’ tier represents a 75-percent hit rate. His ‘Long Shot’ tier is prospects with a 25-percent hit rate. In most classes his model would be ‘wrong’ on at least one from each tier. However, while Drew may find less pushback on Twitter if 100-percent of bulletproof players busted and zero long shots hit, it would be a more damning result for his model’s predictiveness.
While The Breakout Finder doesn’t place prospects in buckets, it also affords each player a probability of success. Among 10 receivers with 60-percent breakout ratings, we should expect six to have 200 PPR points or 1,000 yards. If every 60-percent player breaks out, the model isn’t hitting; it’s likely too conservative.
The best way to capture the success of a model is whether the purported odds to succeed over a given sample continue to manifest. While in a vacuum, a ‘bust’ tier hit such as Elijah Mitchell is surprising, when viewed in the context of all bust tier players, and their collective odds to hit, it’s hardly so. As Drew says, always remember the denominator.
The Duality of Context
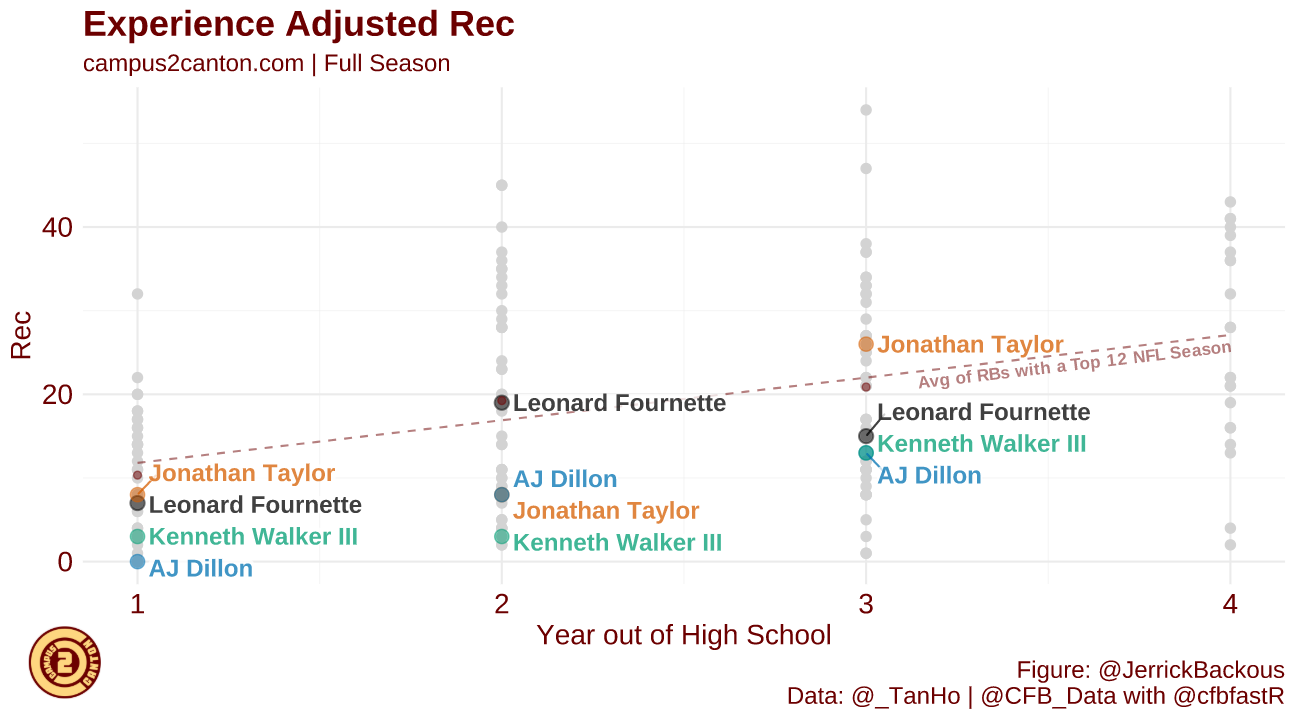
One of the most frequent sources of pushback I receive on my work is that I’m ignoring context. This is both true and not true. An example of this is Michigan State running back Kenneth Walker. I have been vocally skeptical of Walker as a top running back prospect in the 2022 class primarily due to an outlier, low level of receiving work. As shown below, Walker is set to join a very small and mostly uninspiring group.
If we assume Walker goes in the top-100, here's a list of backs who were drafted in the top-100 with a sub-6% best-season reception share. This includes the last two years, too, so 2011-2021:
Ronald Jones
D'Onta Foreman
Derrick Henry
Kenyan Drake
Christine Michael— JJ Zachariason (@LateRoundQB) February 11, 2022
Supporters of Walker have claimed that other recent running backs such as Jonathan Taylor came into the league with limited pass-catching production and grew in the NFL. The below table compares Walker with three such backs who have become at least serviceable receivers.
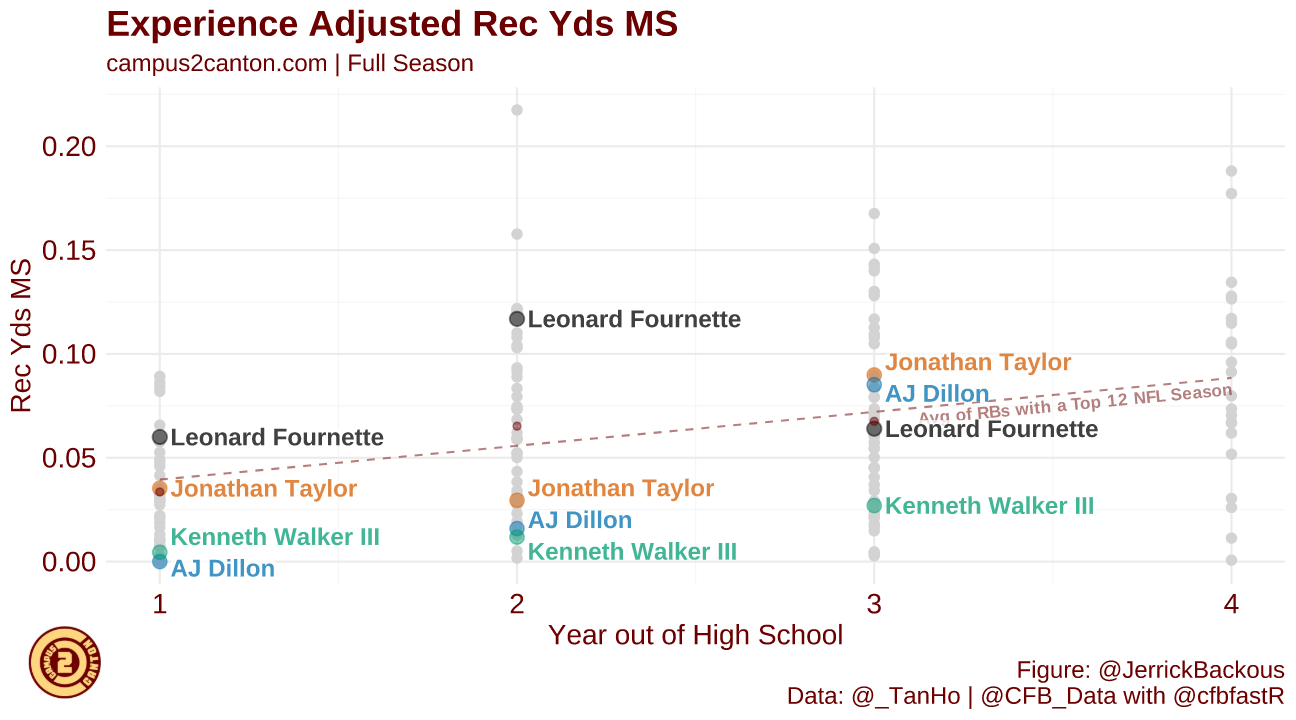
However, when you consider the context of their offences, the difference between Walker and some of his apparent comparables surfaces. Unlike the above diagram, both from Campus2Canton, this plots each back by their share of team receiving yards rather than receptions. Unlike the other three backs, Walker’s offence passed the ball plenty; just not to Walker.
In my view, this framing is taking context into account. Others however, take it a step further; claiming that Walker’s teams at Michigan State and Wake Forest did not scheme to throw the ball to running backs, thus Walker’s numbers aren’t indicative of his ability. This is at least partially true! Compared to the offences Breece Hall and Isaiah Spiller played in, Michigan State did throw less to their backs. However, Walker never even commanded the majority of his own team’s running back receiving yards, and his team’s percentage of receiving to the position declined when Walker joined the team in 2021. At what point does a player become responsible for their own context?
Recalling the Denominator
While it is entirely possible Walker has untapped potential that was limited by his scheme, this is not the first highly-drafted, productive rusher with receiving concerns who played college for a team named after a warrior from the classical era. Like Walker, Ronald Jones‘ Trojans did not throw often to running backs. As with Walker, when his team threw to running backs it was not consistently to Jones.
When I approach Kenneth Walker in my rookie drafts, I am not ignoring context. I am folding the contextual factors at play into the probability he is an outlier which exists for any player. But as a likely first round rookie pick, I expect a handful of higher probability bets to be on my draft board when others are selecting Walker.
Reducing Your Strike Zone
This is not an article about why analytics is superior. It is however an article I hope helps folks understand the basis of data-based prospecting and why its goals differ from film-based analysis. Rather than starting from the perspective of each player and exploring how that player can succeed, I typically analyse the larger sample and how each player measures up. Does this player resemble other players who often hit? Or not?
The underlying basis of this approach is one of opportunity cost. Each time you are on the clock, you pass up an array of alternatives to make your selection. If you can use data, ‘buckets,’ and predictive analytics to determine classes of players who will hit at a higher than base rate, it is in your interest to reduce your pool of considerations to that class. Think of yourself as a baseball slugger. If you have zero strikes against you and hit best on inside pitches, you’re better off taking a pitch outside. Even if it’s called a strike, you still have chances to get a hit on pitches more favourable to you. It matters less if you might get a hit on an outside slider, and more if you have a better chance at doing so than getting on base over the remainder of the at-bat.
Don’t Chase the Apple
To close this piece let’s get back to the apple tree. In the initial thought experiment all we knew about the apples were their colour. Beyond that each was indistinguishable from the next. We know of course that prospects are not like this. While in the eyes of a model every prospect in a given bucket has the same odds of success, the mission of many players, especially film-based players, is to examine each apple for indicators why its odds to sell are higher or lower than its’ tree-mates.
If you or someone you follow can identify on a case-by-case basis, characteristics of each apple that determine its saleability with higher correlation than colour, you should use that process. But often times we learn too much from each right or wrong guess and input new rules when they may be functions of variance.
Chase The Tree
In each of the last three years N’Keal Harry, Jalen Reagor and Rondale Moore have had underwhelming starts to their career despite excellent analytical prospect profiles. Each year the consensus has bequeathed different reasons why their lack of success was foreseeable. Harry could not separate. Reagor played in the Big 12 conference. Rondale Moore is too short. So should we now avoid every short player, non-separator or big 12 player?
Some may say we should simply view each player in their own context to determine what rules to apply. I would argue these players most likely failed because sometimes good prospects bust, and often the reasons don’t reveal themselves until after the fact, if at all. If Drake London busts this year I’m sure the separation topic will once again be top of mind. What if Jameson Williams is the bust of the class? Do we start caring about Body-Mass-Index again? Or is it because of his breakout age? How could that be when an under-sized late breakout in DeVonta Smith just had a successful year?
If you hold yourself to the standard of foreseeing the result of every player you are bound to fail. But if you can create or follow a model that hits at a higher rate than average at ADP, you have a winning formula.
Final Thoughts
Why do I refer to analytics-based prospecting as prospecting through humility? Because you are not claiming the ability to sort between which context matters and which outliers will emerge. Certainly some have that ability and I hope they stay out of my leagues! But for the rest of us mere mortals, keep in mind you are making probabilistic bets, not predictions. When unexpected results occur, always remember the denominator. The unexpected is likely more expected than you think.


