Super Bowl LV is a story two years in the making as the Kansas City Chiefs and Tampa Bay Buccaneers meet in Tampa to crown the 2021 Super Bowl champions. Back in 2019, Patrick Mahomes put the NFL on notice when he threw for 50 touchdowns in his first year as a starter and won league MVP. A Dee Ford penalty allowed Tom Brady and his New England Patriots to sneak past the Chiefs and beat the Rams in the Super Bowl. The following season, Mahomes avoided a serious knee injury to lead the Chiefs to a Super Bowl victory over Kyle Shanahan and the 49ers. Four seasons before that, Shanahan’s Falcons infamously lost to Brady’s Patriots in the Super Bowl.
With advanced stats and analytics provided by PlayerProfiler on offense and team defense stats from Pro Football Reference, we will break down the Super Bowl matchup position by position and to show how the two teams match up with one another.
Patrick Mahomes
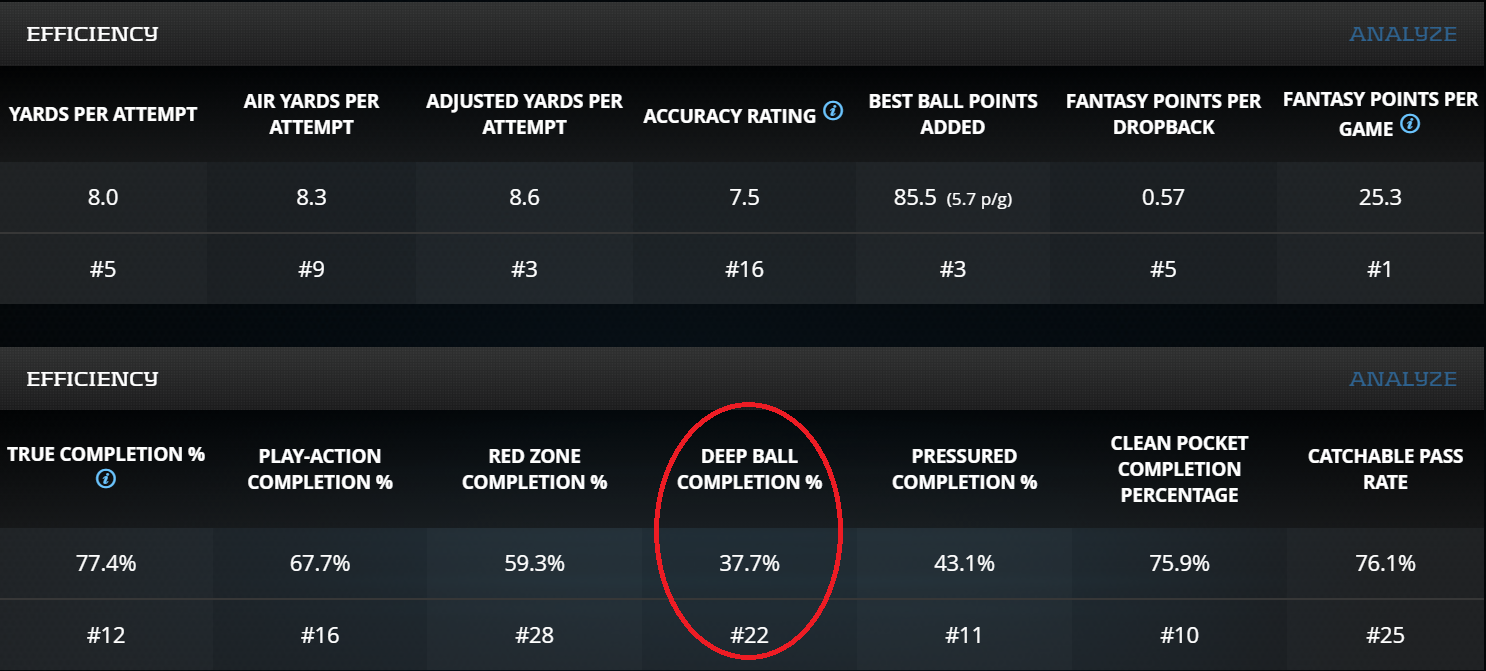
The story to watch for Patrick Mahomes entering the Super Bowl is his offensive line protection. Mahomes ended the 2020 season with an 83.9-percent (No. 21 among qualified quarterbacks) Protection Rate, the second straight time he’s finished outside the top-20. His 43.1-percent (No. 11) Pressured Completion Percentage is a slight dip from his 44.5-percent (No. 5) mark in 2019, but the Chiefs will struggle to limit pressure to Mahomes with his blindside protector, Eric Fisher, out for the game after he suffered a torn Achilles. A noticeable difference in Mahomes’ game this season is the deep ball. The 69 (No. 6) Deep Ball Attempts are nearly identical to last season’s 68 (No. 11); however, his Deep Ball Completion Percentage dropped from 48.5-percent (No. 3) in 2019 to 37.7-percent (No. 22) in 2020.
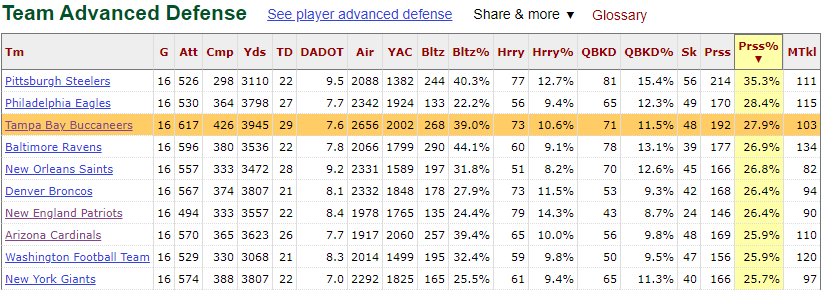
The Tampa Bay pass rush, led by Shaquil Barrett and Jason Pierre-Paul’s five sacks and 12 pressures in the NFC Championship Game, blitzes at a 39.0-percent (No. 5) rate and generates a 27.9-percent (No. 3) Pressure Rate according to ProFootballReference. In the NFC Championship, the Bucs defense faced a similar gunslinger to Mahomes in Aaron Rodgers. In 2020, Rodgers’ 43.1-percent (No. 11) Pressured Completion Percentage was identical to Mahomes. He had 72 (No. 3) Deep Ball Attempts, topping Mahomes’ total because he played in Week 17. Rodgers was more successful with his deep throws, compiling a 44.4-percent (No. 11) Deep Ball Completion Percentage.
The deep ball is the key to this game for the Chiefs to win. The Bucs defense allowed a 7.6 aDOT, which is the fifth-lowest among all defenses. In the NFC Championship Game, they allowed four deep completions. Two of the completions contributed to one touchdown drive, one more to a second touchdown drive, and the final contributing to a drive ending in a field goal. In total, the Green Bay Packers scored 17 points when they completed a deep throw on a drive. When they did not complete a deep throw, they scored nine points (one touchdown, one field goal), punted three times, and turned the ball over twice. The Bucs make it difficult to complete deep passes thanks to their pass rush, and if they succeed in taking away the deep ball from Mahomes as they did with Rodgers, then they will win.
Tom Brady
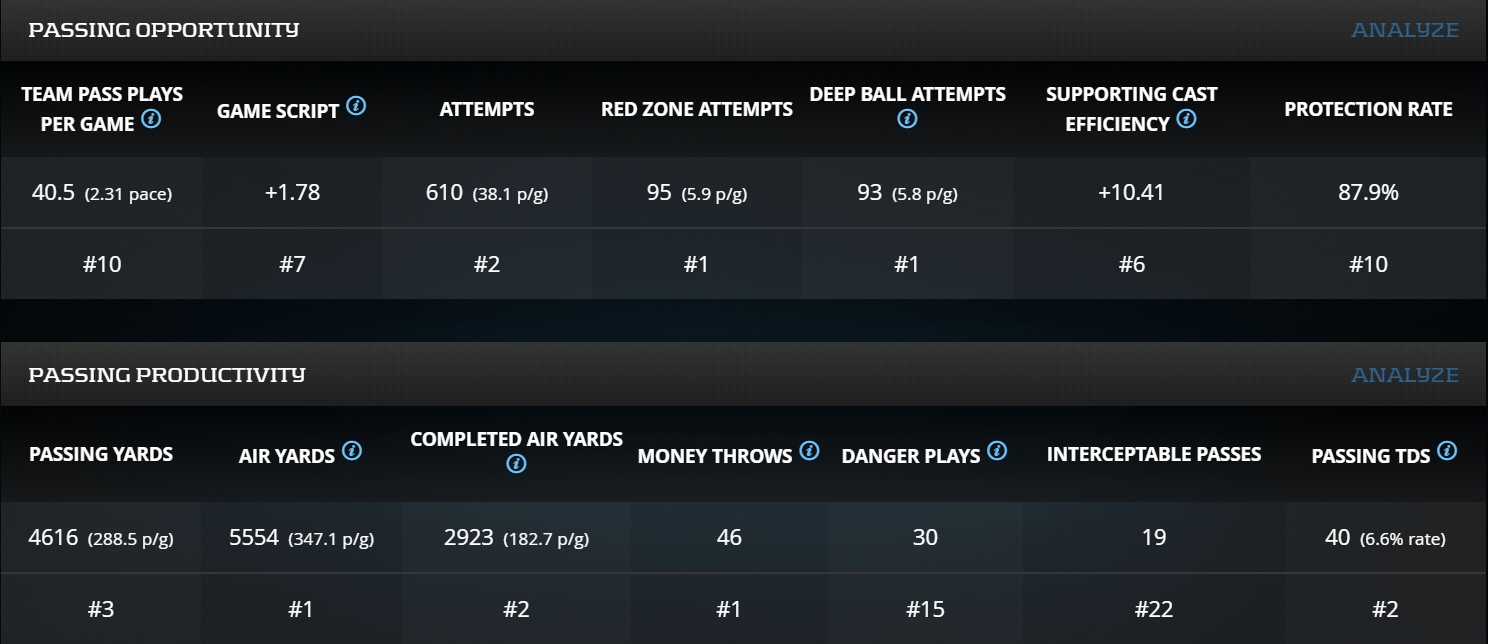
There’s a reason that Tom Brady left the New England Patriots in the offseason. The front office failed to surround him with weapons on offense last season, evidenced by the -0.86 (No. 17) Supporting Cast Efficiency rating in 2019. It’s clear by this year’s +10.41 (No. 6) Supporting Cast Efficiency rating that leaving the Patriots was the right decision. Brady returns to the Super Bowl, while New England’s -3.97 (No. 22) Supporting Cast Efficiency is a big reason for their playoff absence. Brady leads the NFL with 46 Money Throws and 9.1 Air Yards Per Attempt, while throwing to the most talented group of wide receivers he’s had since Randy Moss and Wes Welker back in the 2007-2009 seasons. The question for Brady is can his receivers create after the catch?
The two frustrations for Brady this season are that his receivers have 71 (No. 8) drops this season and they average 2.95 (No. 65) Receiver YAC Per Target. The Chiefs defense allows 3.75 (fifth-most) YAC Per Target, while limiting opposing offenses to 3.86 (seventh-fewest) Air Yards Per Target. This is the exact opposite of what the Bucs do on offense. The Chiefs blitz 35.7-percent (No. 9) of the time and bring pressure 24.8-percent (No. 12) of the time to minimize Air Yards with the help of the coverage of their defensive backs. Unlike the Bucs, who blitz because of their coverage deficiencies in the defensive backfield, the Chiefs blitz because they can trust their defensive backs to cover receiver one-on-one.
Kansas City Chiefs Running Backs
Clyde Edwards-Helaire’s 56.9-percent (No. 9) and Darrel Williams’ 79.5-percent Light Front Carry Rate are top-10 among running backs. Playing alongside Patrick Mahomes does that for his running backs; ask Damien Williams, who had a 60.4-percent (No. 8) rate in 2019. Both Chiefs backs are in trouble this Sunday though.
In the NFC Championship game, Aaron Jones, Jamaal Williams, and A.J. Dillon combined for 16 carries and 67 yards and nine catches for 42 yards against the Bucs. Jones’ 97.8 (No. 2) Run Blocking Efficiency rating and Williams’ 81.4 (No. 26) mark should have led to greater success on the ground. However, the Bucs proved that their 14.1 (No. 2) fantasy points allowed to running backs and 80.6 (No. 1) rushing yards allowed per game was no fluke. The Chiefs backs will run behind an offensive line that managed a 70.1 (No. 45) Run Blocking Efficiency for Edwards-Helaire and, as mentioned earlier, that offensive line is now missing Eric Fisher.
Tampa Bay Buccaneers Running Backs
Leonard Fournette, aka “Playoff Lenny,” is a prime example of why Matt Kelley doesn’t take L’s in fantasy football. During the season, Fournette’s 66.5 (No. 54) Run Blocking Efficiency rating contributed to his porous 3.5 (No. 65) True YPC average. He has been a surprising revelation on the ground in the playoffs, averaging 4.4 yards per carry on 48 attempts. With improved production on the ground this postseason, will he continue to see a 43.3-percent (No. 18) Base Front Carry Rate? Only six running backs saw a higher rate and averaged fewer than Fournette’s 3.8 YPC this season. Now running better than he did in the regular season, he should face a more stacked box. He welcomes an increase to his 17.5-percent (No. 41) Stacked Front Carry Rate; he averaged 4.8 YPC when facing 7-plus defenders in the box.
Ronald Jones and his 81.9 (No. 25) Run Blocking Efficiency have evaporated in the playoffs thanks to a late-season quad injury. Jones’ six (No. 4) drops have limited to him spelling Fournette in the playoffs and he only played 18 snaps in the NFC Championship game. That’s a shame for Jones because Playoff Lenny will feast against the Chiefs defense. Tampa’s 2020 playoff leader in receptions (14) faces a defense that gave up 93 (No. 3) receptions for 846 (No. 1) yards to running backs in the regular season.
Tyreek Hill
The dark-horse candidate for Super Bowl MVP is Tyreek Hill. He matches up with Sean Murphy-Bunting, PlayerProfiler’s No. 111-ranked cornerback, in the most important game of the season. Murphy-Bunting allowed an NFL-high 11 touchdowns, and his 0.48 (No. 71) Fantasy Points Allowed per Cover Snap and 2.10 (No. 73) Fantasy Points per Target have Hill licking his lips.
———-THREAD ALERT———-
28 WRs averaged 2.00 yards or more per route run in the 2020 season.
Why is yards per route run (YPRR) significant? All of the top-10 and 12 of the top-14 WRs in PPR fantasy points per game were among the 28 WRs.#PlayerProfilerDataAnalysis
1/
— Aaron Stewart (@aaronstew09) January 18, 2021
Hill averaged 0.58 (No. 3) Fantasy Points per Route Run and 2.45 (No. 3) Fantasy Points Per Target during the regular season. He had 835 (No. 7) Completed Air Yards this season, while the Bucs pass defense allowed 2,656 (No. 4) Air Yards to wide receivers. He also averaged 2.26 (No. 14) Yards per Route Run, topping the 2.00 mark that top fantasy receivers hit in 2020.
Tampa Bay Buccaneers Wide Receivers
On the other side of the Super Bowl matchup, Chris Godwin and Mike Evans prepare to face a defense that only allowed 19.7 (No. 4) Fantasy Points per Game to the wide receiver position. Their dominance against wide receivers is due to L’Jarius Sneed (PlayerProfiler’s No. 7-ranked cornerback) and Bashaud Breeland (No. 9) solidifying the cornerback position.
Breeland’s +50.3 (No. 5) Coverage Rating was a combination of his 50.8-percent (No. 3) Catch Rate Allowed and 15.6-percent (No. 3) Target Rate. Quarterbacks weren’t throwing towards Breeland often, and the lack of success they had when they did led to his 0.22 (No. 1) Fantasy Points Allowed per Cover Snap. Evans and his 18.6-percent (No. 3) Touchdown Rate is dependent on winning one-on-one situations. More often than not, he loses these situations with a 43.5-percent (No. 59) Contested Catch Rate. Breeland’s 0.98 (No. 20) Target Separation average will challenge Evans’ ability to secure his deep and red zone targets.
Check out Mike Evans on PlayerProfiler’s New DYNASTY DELUXE Rankings:
Target Separation is the key to the WR-CB matchups for the Bucs wide receiver group. Evans’ 1.79 (No. 48) and Godwin’s 1.62 (No. 56) Target Separation marks show that it’s not a strong point for them. Their lack of separation contributes to their 2.57 (No. 42) and 2.63 (No. 41) Yards after Catch averages. Creating separation from their coverage is key because the Chiefs allow 5.98 YAC per completion. This is the third-highest amount allowed per completion by an NFL defense in 2020. With a +47.6 Coverage Rating and a 52.3-percent Catch Rate Allowed, Godwin will face difficult coverage from Sneed, who will affect Godwin’s Catchable Targets in the Super Bowl; he saw an 89.3-percent (No. 4) Catchable Target Rate in 2020.
Travis Kelce
The Bucs defense when defending tight ends has a “bend but don’t break” philosophy. The 86 receptions given up to opposing tight ends is seventh-most by an NFL defense, but the 9.67 yards per catch is the third-fewest allowed by a defense. Their philosophy is to prevent tight ends from getting behind the defense and breaking open plays, which will be challenged by Travis Kelce.
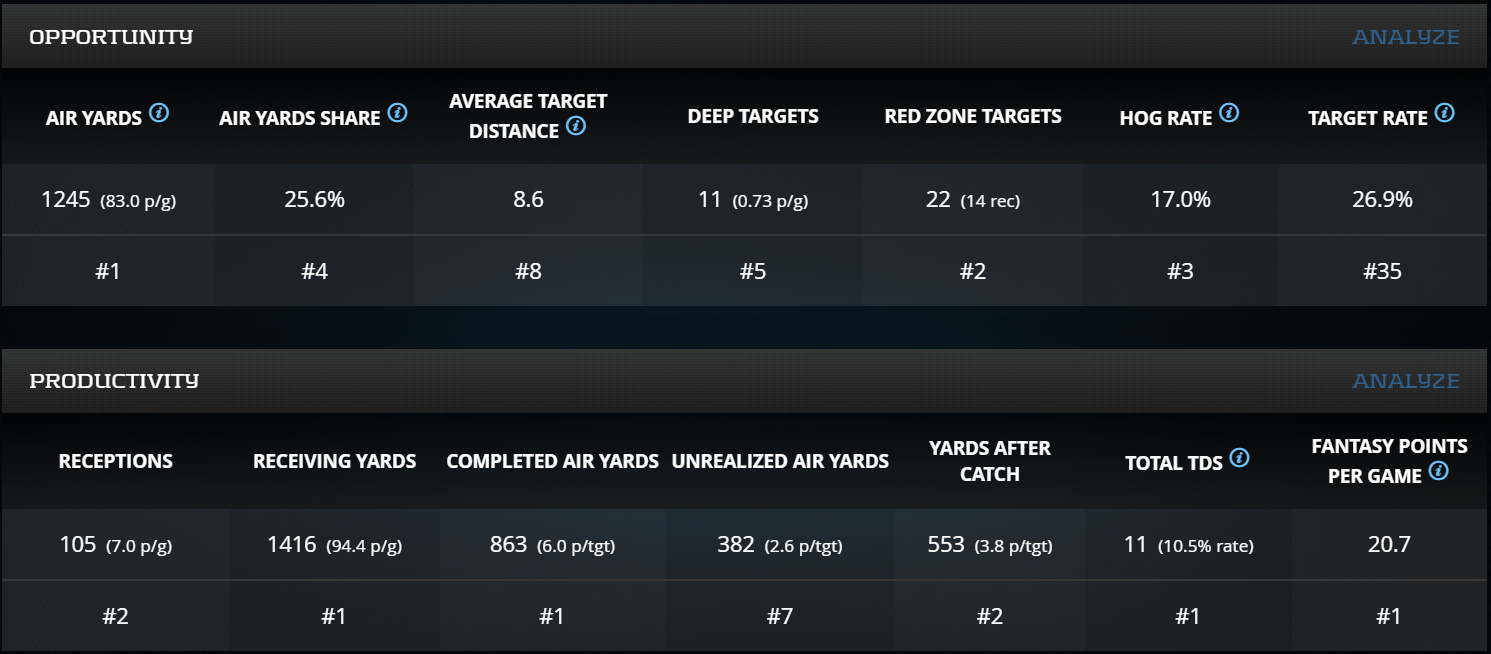
In 2020, Kelce averaged 13.5 (No. 4) Yards per Reception and had 553 (No. 2) Yards after Catch. Last week against another poor tight end fantasy defense in the Buffalo Bills, Kelce finished with a 13-118-2 stat line on 15 targets. Robert Tonyan had a 4-22-1 state line against the Bucs in the NFC Championship Game, with 13 of his 22 yards coming after the catch. Tonyan, a 105.9 (51st-percentile) SPARQ-x athlete, has similar workout metrics to Kelce. Expect the Bucs to hold Kelce under his 9.8 (No. 4) Yards per Target average like they did to Tonyan last week (9.9, No. 1).
Tampa Bay Buccaneers Tight Ends
Cameron Brate has made more plays (11-149-1 on 16 targets) than Rob Gronkowski (2-43-0 on seven targets) thus far in the playoffs. Gronkowski was on the field for more plays (58) than Brate (23) in the NFC Championship Game though. It’s not surprising to see Brate heavily targeted despite limited playing time since he had a 12.8-percent Hog Rate during the season, which was higher than Gronkowski’s 10.0-percent (No. 27) mark. Gronkowski has the advantage over Brate in the targets that matter, with 17 (No. 1) Deep Targets and 17 (No. 7) Red Zone Targets compared to Brate’s 2 (No. 37) Deep Targets and 4 (No. 48) Red Zone Targets.
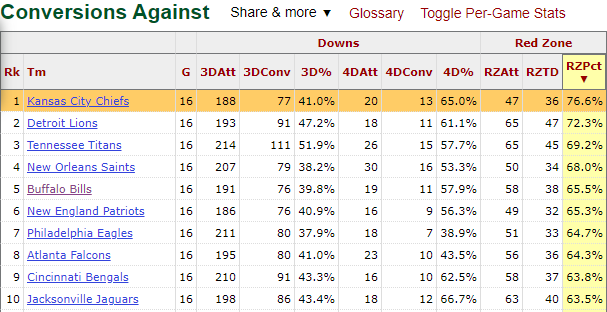
This matchup favors Gronkowski, with the Chiefs allowing 8.02 yards per target (seventh-highest) and 9.2 (seventh-highest) fantasy points to tight ends. Mike Evans leads the Bucs with a 21.8-percent (No. 22) Red Zone Target Share, but faces tough cornerback coverage as discussed earlier. Gronkowski’s 19.5-percent (No. 14) Red Zone Target Share is the next highest on the team, and the Chiefs defense allows a touchdown on 76.6-percent of the opposing offense’s red zone attempts. That is last among NFL defenses, although the 47 red zone attempts is the sixth-fewest attempts allowed by a defense.

